
FIELD NOTES
Look across the course.
Look beneath the average.
Short stories from real measurements, with the context needed to understand what changed and what the data can tell us.
FIELD NOTES / 01
One straight.
Different ground.
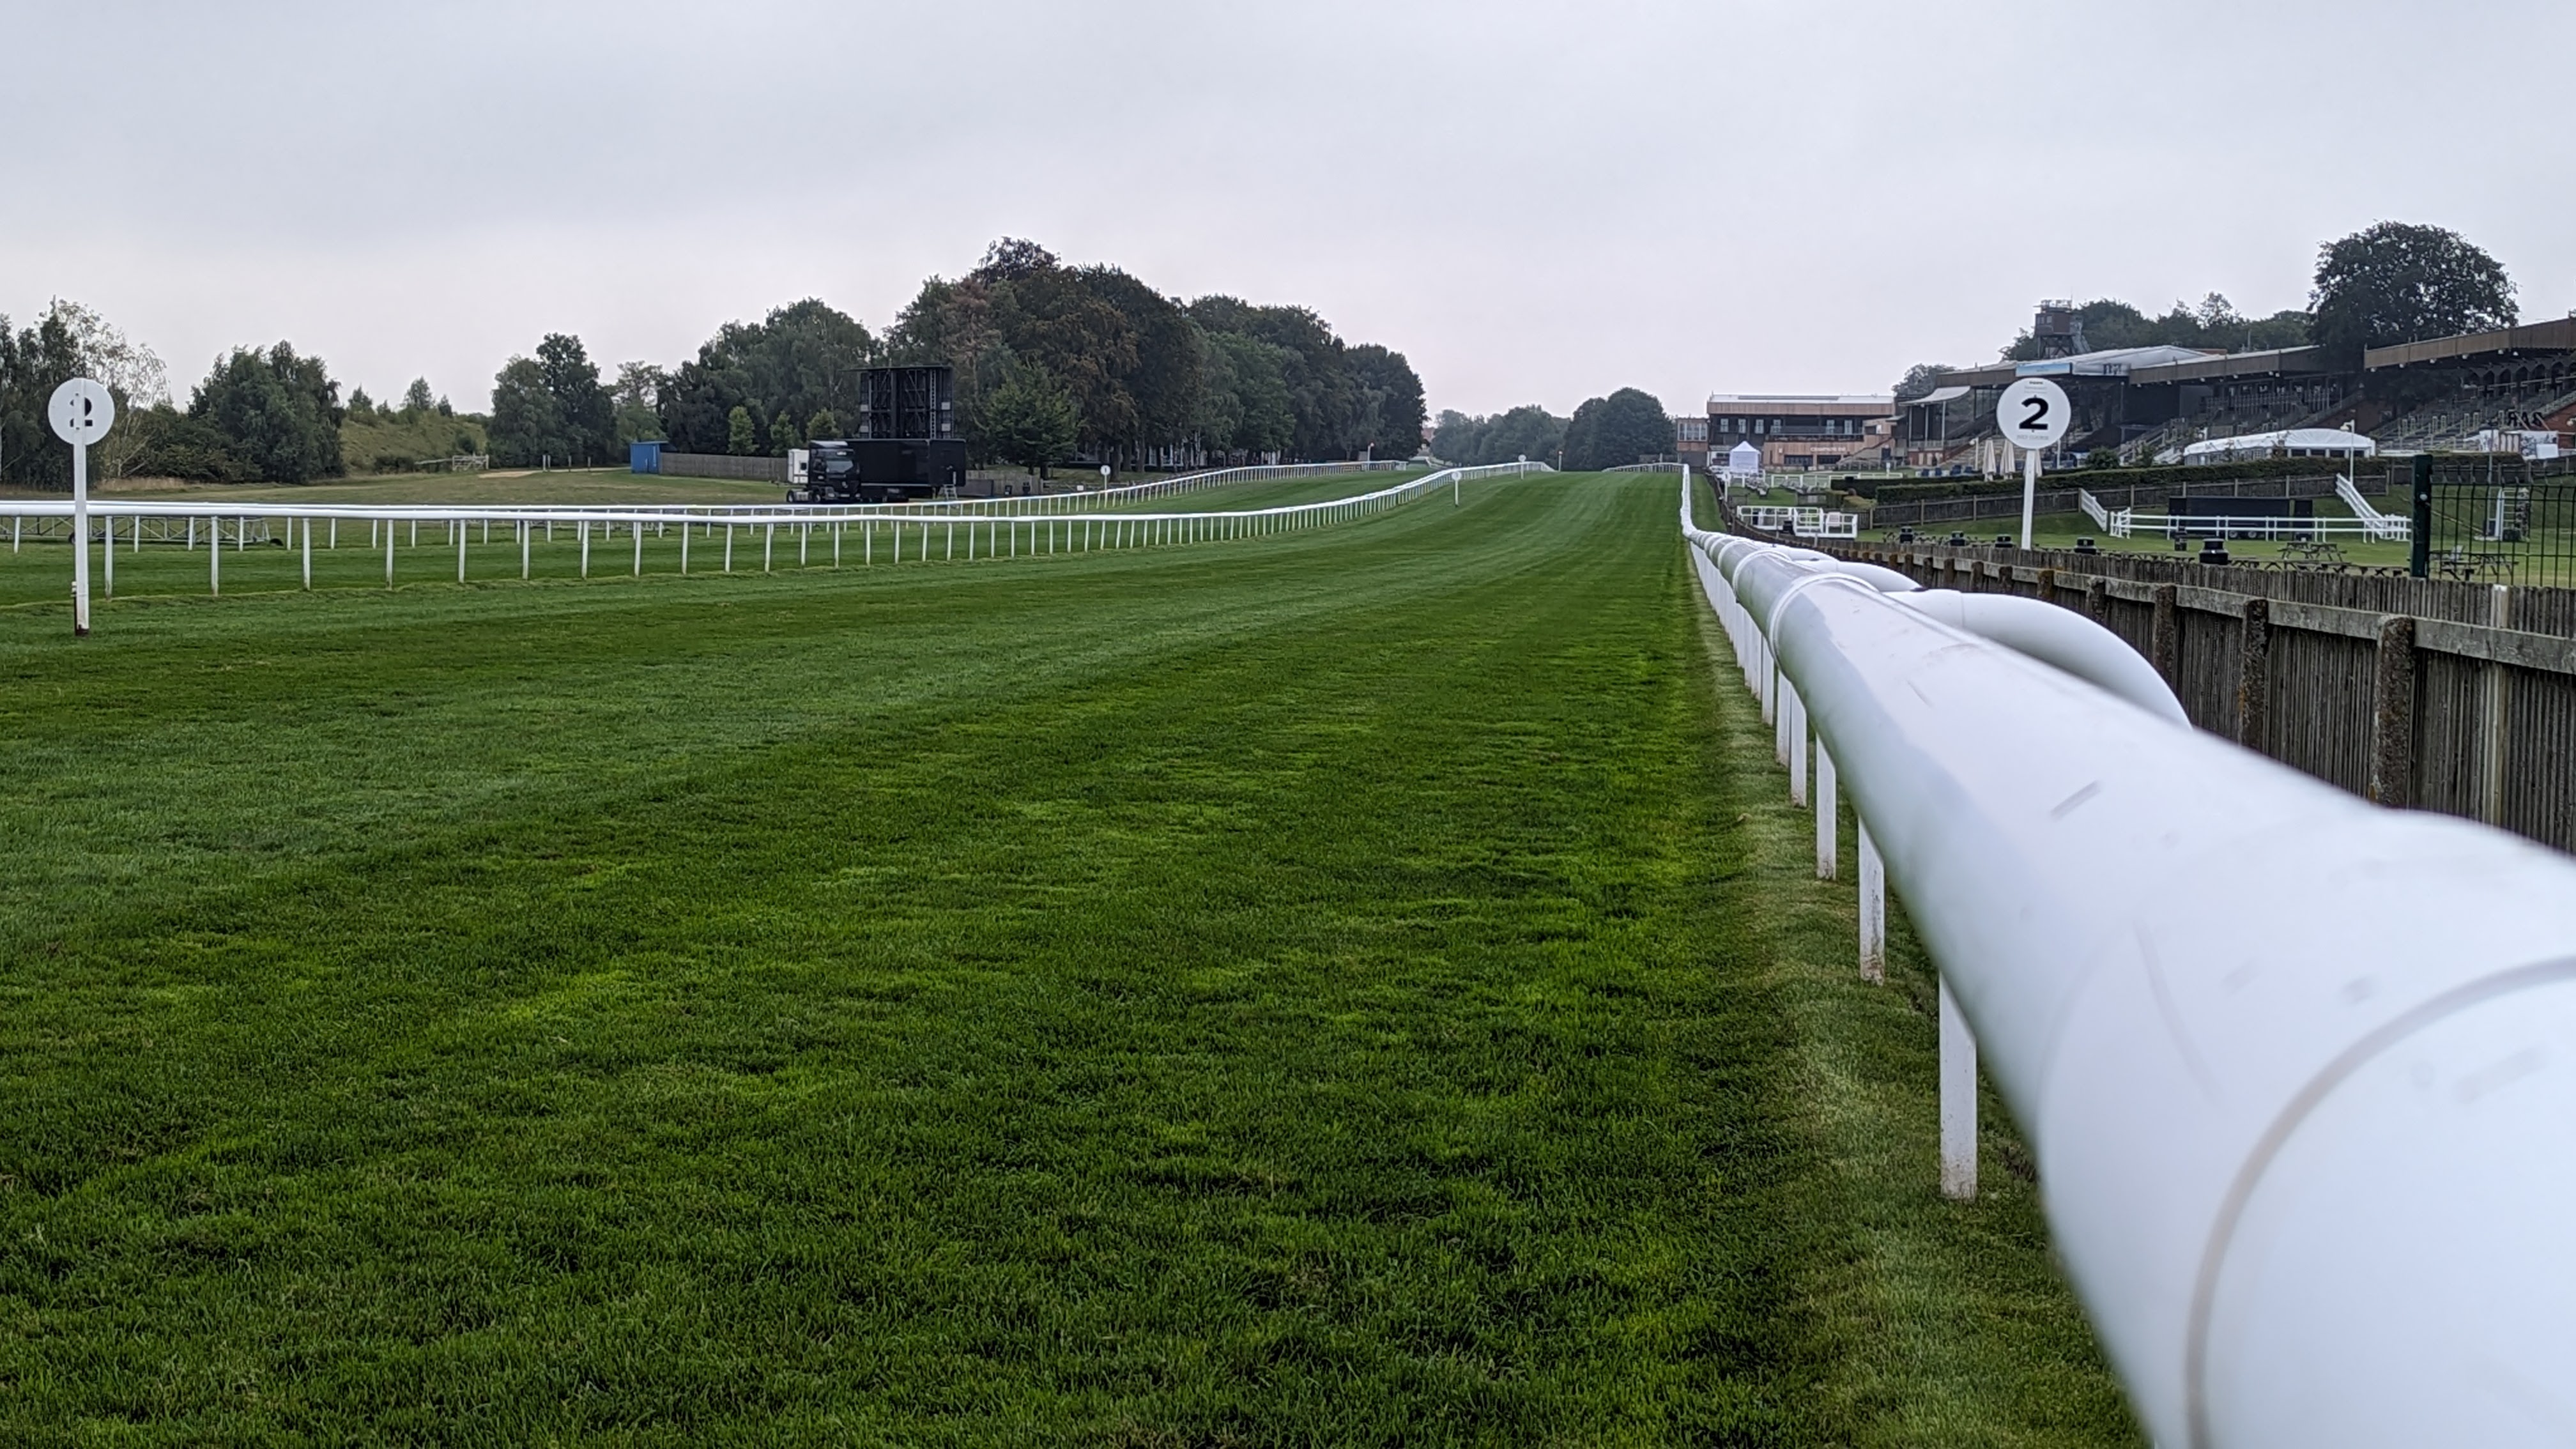
A course average is a starting point. Look across the running lines, then follow how the response changes over time.
Anonymised course · morning measurements · schematic layout
AT THE WINNING POST
A different response
across three lines.
About these measurements
Day 1 uses a single reference line. Days 2 and 3 use separate inside, middle and outside lines at seven locations. Readings describe the sampled morning conditions; later rainfall means they are not race-time measurements.
Cushioning colours use the interpretation bands from this particular report and are not an official going declaration. Upper and lower firmness use a separate blue scale. The diagram does not represent horse trajectories or identify a fastest line.
FIELD NOTES / 02
One course.
Three days.
The earlier film follows how the recorded ground changed across three days. Repeated monitoring adds a time dimension to the spatial variation.
Day 1 is a single-line reference. Days 2 and 3 include inside, middle and outside measurements. Where a running strip moves, the comparison describes the ground available that morning rather than repeated testing of exactly the same turf.
Ground measurements inform discussion alongside weather, ratings, pace, weight and race conditions. They do not explain a result on their own or identify a fastest measured line.
Original Groundlytics film · silent version · 46 seconds
NEXT STEP
Could repeated monitoring help your venue?
We can agree a sampling plan that makes change easier to follow.