
TECHNICAL INFORMATION
Repeatable impacts.
Recorded responses.
The device specification, recorded outputs and practical testing process, with an illustration of how changing the drop height changes the input.
Ideal free fall using m = 6.15 kg and g = 9.81 m/s². These are calculations, not measured surface response or cushioning.
DEVICE SPECIFICATION
Portable hardware.
Detailed output.
The sphere is dropped onto turf or other sports surfaces to examine mechanical response. The original device description uses around 15 drops per location across varied heights and nearby spots; project protocols can prescribe a different series.
The LED bar helps the operator cover the planned drop range and measurements. Data are recorded for subsequent analysis.
- Sphere mass
- 6.15 kg
- Sphere diameter
- 20.4 cm
- Drop-height capability
- From 5 cm to more than 80 cm
- Data storage
- Formatted microSD card; CSV files
- Operator feedback
- Colour LED status bar
- Battery
- Rechargeable 1000 mAh LiPo
- Operating time
- Approximately 6 hours of continuous use
RECORDED PARAMETERS
What the electronics record.
| Parameter | What it describes | Unit / interpretation |
|---|---|---|
| Impact velocity | The recorded speed of the sphere at impact. | m/s |
| Gmax / firmness | Peak acceleration during the impact response. | g |
| Stiffness / spring rate | Resistance to deformation under the testing conditions. | Protocol-defined |
| Penetration depth | The sphere’s penetration or deformation response. | mm |
| Energy restitution | The rebound response following impact. | % / coefficient |
| Resonance frequency | A recorded dynamic response property. | Frequency |
| E-modulus | A calculated material-response property from the device output. | Protocol-defined |
Derived measures and interpretation bands depend on the research model and protocol. A drop-height calculation does not predict peak force, cushioning or a horse’s response.
FROM CSV TO INTERPRETATION
The protocol
makes comparisons useful.
Drop heights, repeats, station spacing and instrument combinations are defined for the project. Recorded impact conditions allow readings to be compared within that design.
GPS-linked locations support mapping. Separate moisture measurements add context, while repeated visits can help distinguish variation across the course from changes over time.
Research protocols can combine the VST, moisture meters and GoingStick measurements. Those instruments describe different outcomes; they are considered together rather than treated as interchangeable.
How the data become reports →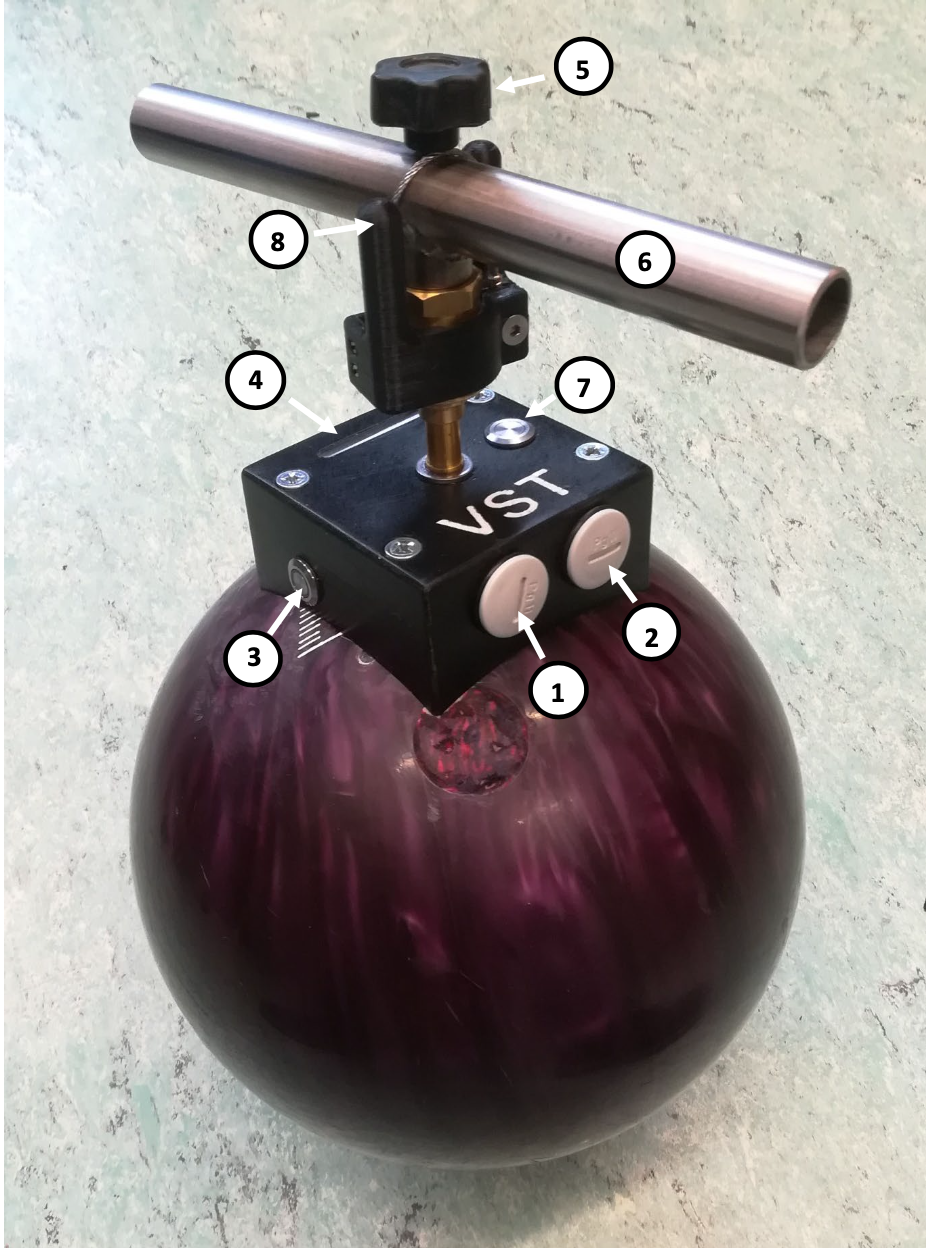
NEXT STEP
Need a particular testing protocol?
Tell us the surface, questions and measurements your project requires.