Firmness
Peak acceleration during impact. Upper and lower response measures can be compared rather than collapsed into one value.
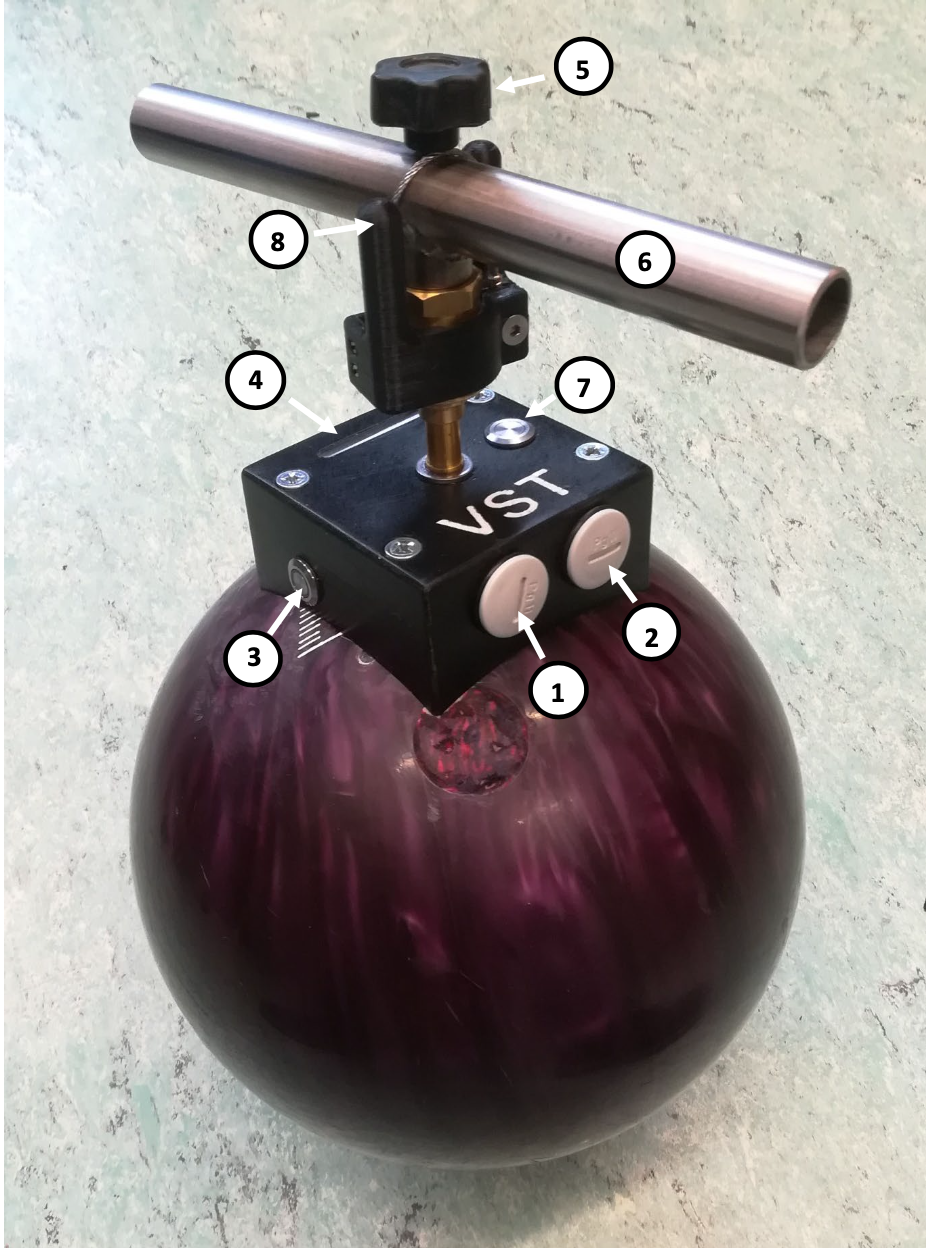
THE VIENNA SURFACE TESTER
The Vienna Surface Tester uses repeatable drops to examine how a surface responds under different impact conditions.
Technical details ↗WHY IMPACT TESTING?
Walking a course provides valuable practical information, but an instrumented impact adds a repeatable way to examine mechanical response. The VST is a portable sphere with internal electronics that record what happens during a drop.
Measurements at different heights provide different impact conditions. Comparing those responses can reveal patterns that are not clear from a single reading or a course average.
The VST adds objective context alongside traditional going assessment, venue experience and other instruments. It is used in research and practical surface monitoring across racing and eventing.
READING THE RESPONSE
Each measure describes a different aspect of the surface. Together, they build context for interpretation.
Peak acceleration during impact. Upper and lower response measures can be compared rather than collapsed into one value.
A peak-force-based response estimated using VST and moisture data in the relevant research model.
Describes the restitution or rebound response following impact, considered within the testing protocol.
Penetration and spring-rate response help describe deformation and resistance during the impact.
A moisture meter provides water-content readings alongside the VST. Soil moisture is part of the interpretation and, where required, the cushioning calculation. The VST itself is an impact instrument.
COMPARING RESPONSES
In the anonymised field example at 1F, the inside line had the highest upper firmness reading while the outside line ranked highest for lower firmness. Comparing both responses reveals that change in ranking.
“Upper” and “lower” here refer to response measures under different impact conditions. They should not be read as direct moisture samples from fixed physical depths.
Explore the real measurements →Compare patterns within each measure.
Use the full response profile for context.
RESEARCH & LONG-TERM USE
The VST has been compared with the Orono Biomechanical Surface Tester (OBST) in published research. That work informs the use of VST and moisture measurements to estimate cushioning; it does not make every instrument output interchangeable.
Repeated measurements help follow surface change associated with weather, watering, use and maintenance. Differences can prompt further investigation into drainage, wear or localised ground response.
International applications include racing and eventing research, with U.S. pre-meeting turf testing among the uses described on the original website. Interpretation remains specific to the surface, question and protocol.
NEXT STEP
Tell us about your course, venue or research project.