
Home Services

SERVICES

Measure the ground.
Understand the response.

A single visit, repeated monitoring or a research programme: the service is built around the questions you need to answer.

Explore service options ↗
FROM FIELD POINTS TO A COURSE MAP
Illustrated mapping process, with sample locations around a schematic courseMEASURE · MAP · MONITORA clearer view of the whole course

Illustrative course outline · no measurement values

01 / RACING

Racecourse monitoring

Race-day and seasonal measurements to help understand the running surface across the course.

Repeated locations make comparisons clearer; sampling can also cover different racing lines and areas affected by use or maintenance.

  • Going and ground-condition context
  • Course variation and separate route summaries
  • Before / after maintenance or major-event preparation
Discuss this service →
02 / EVENTING

Cross-country assessment

Objective readings across fields and sectors, considered alongside the course setting and rider feedback.

The agreed brief can include approaches, take-off and landing areas, crossings or other locations of interest.

  • Sector summaries and mapped measurement points
  • Ground response across changing terrain
  • Research questionnaires where part of the project
Discuss this service →
03 / ARENAS

Artificial surface assessment

Measurements can describe firmness, stiffness, depth and response on artificial equestrian surfaces.

Interpretation is specific to the surface and protocol. Turf-derived cushioning models and going bands are not automatically applied to arena material.

  • Surface response and consistency
  • Repeated testing across use or maintenance
  • A brief suited to the material and venue
Discuss this service →
04 / RESEARCH

Applied field research

Data collection, analysis and reporting for equine surface projects in the UK and internationally.

The sampling protocol, instrument combination and outputs are defined with the project team.

  • GPS-linked field datasets
  • Instrument and rider-feedback context
  • Analysis tailored to the research questions
Discuss this service →

WHAT A VISIT LOOKS LIKE

Plan. Test.
Report. Discuss.

A useful dataset begins with a clear brief and a consistent sampling plan.

01

Agree the brief.

Confirm the venue, route, questions, access and timing. Set the measurement locations and the instrument protocol.

02

Measure in the field.

Use repeated VST drops at each station. Record location and conditions, with soil moisture and other instruments where included.

03

Map and summarise.

Organise the readings, show variation and compare relevant routes, sectors or repeated visits.

04

Discuss the findings.

Explain the measurements with the venue team. Keep interpretation connected to weather, maintenance, use and the limits of the sample.

Where do we sample?

The brochure’s systematic option uses approximately 200 m spacing, with measurements across seven drop heights. Locations can be customised, including established GoingStick points, furlong markers, sectors and specific features. The agreed project protocol determines the final pattern and repeat count.

THE DELIVERABLES

Clear files.
Useful conversations.

Reports can include individual points, course maps, route or sector averages, variation and short comments highlighting the main patterns.

Repeated visits support benchmarking and trend analysis, while one-to-one discussion helps put the readings into the venue’s own ground-management context.

See maps & reports ↗
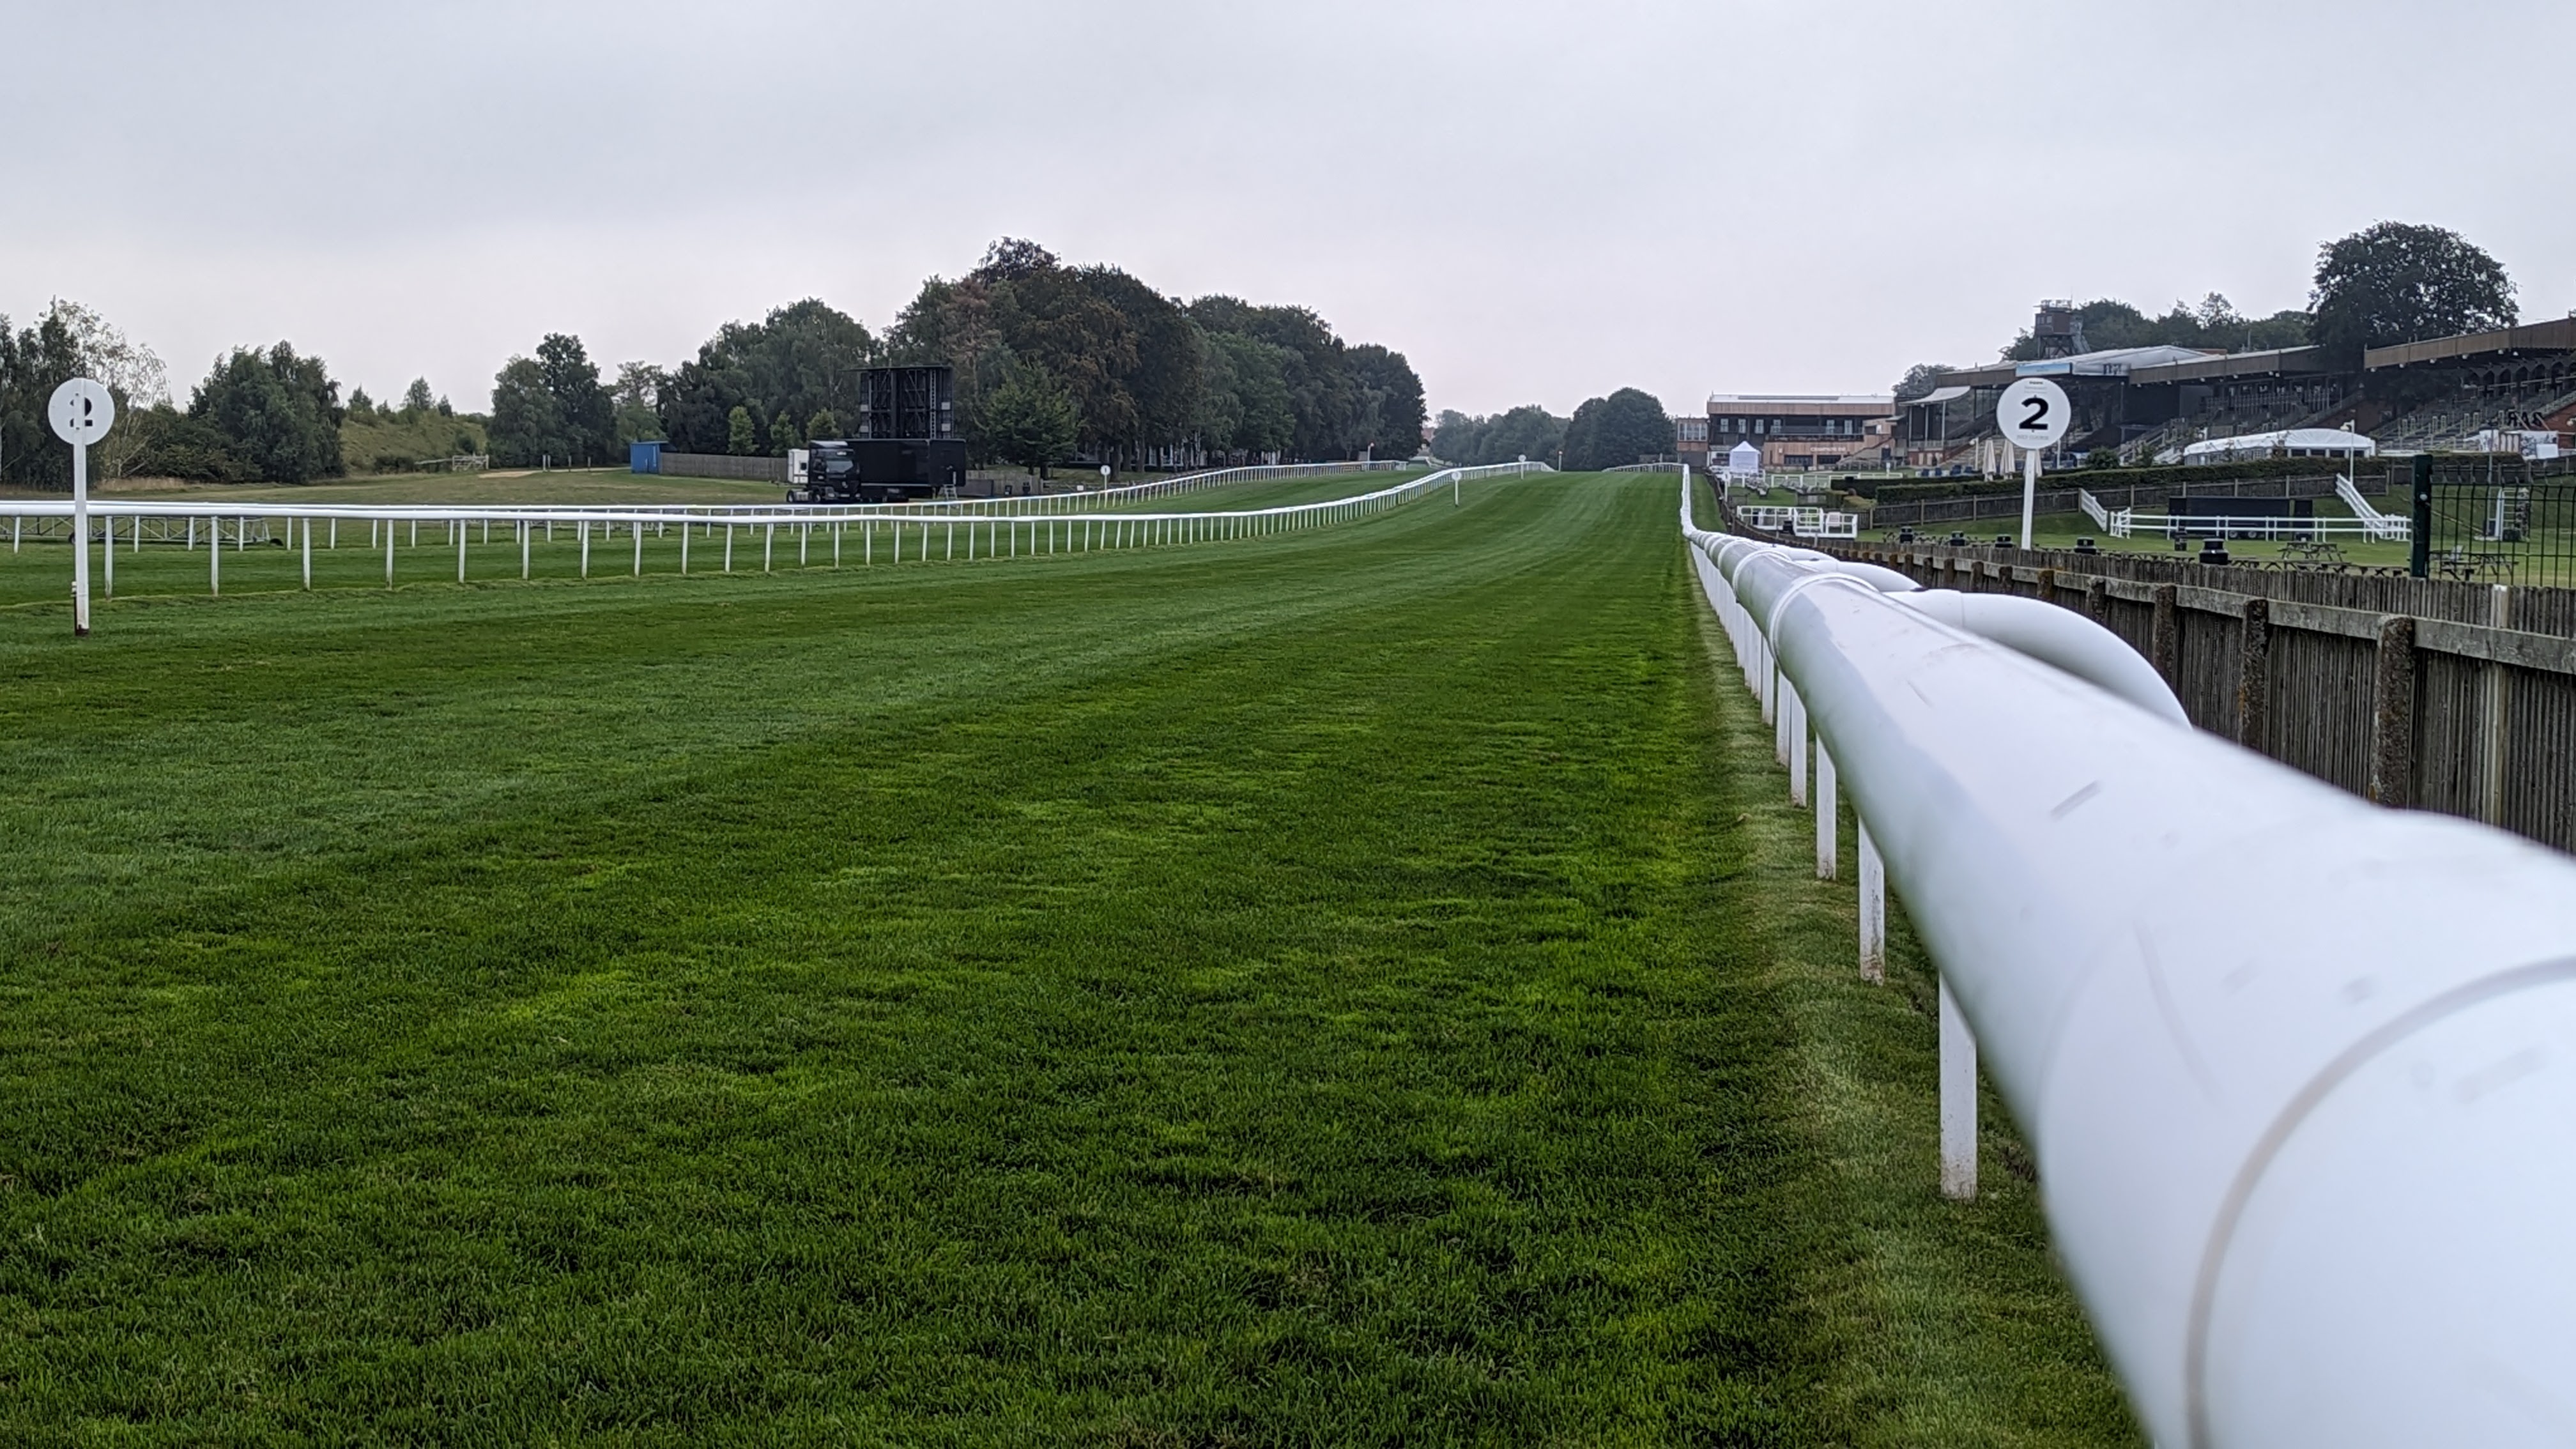
Racecourse running surface and rails
Testing records the ground available at the time of the visit.

NEXT STEP

Let’s talk about your ground.

Tell us about your course, venue or research project.

Start a conversation