Lower allowance means faster performance-based going.
Here, higher cushioning indicates greater support under impact. As cushioning rose, allowance fell: firmer ground was associated with faster going.

PERFORMANCE · INJURY · PRACTICAL CONTEXT
Published research and practical context for the people who ride, train, own and care about horses.
Start with performance
WHY THE SURFACE MATTERS
The hoof lands, the limb loads, the body passes over the planted foot, and the heel lifts for push-off. The FEI white paper explains how the surface supports these phases, including impact, grip, cushioning and responsiveness.
[8] FEI white paper (2014)Measurements of hoof accelerations and ground reaction forces on selected dirt, synthetic and turf tracks also show that the surface can change the horse’s mechanical interaction with the ground.
[5] Setterbo et al. (2009)The hoof meets the surface. Rapid hoof deceleration; the body has not fully loaded this limb.
Published findings help explain why ground information matters before racing.
A British proof-of-concept study of 50 turf meetings found calculated cushioning related to performance-based going derived from normalised race times. The fitted relationship included a plateau across firmer conditions.
[1] Hobbs et al. (2024)“Performance-based going” is a meeting-level assessment from adjusted winning times. It gives researchers a way to compare the performance-based going between meetings.
A New Zealand Flat-racing analysis also found relationships between speed and track condition. Initial and final-600 m speeds responded differently to distance and conditions; horse rating and carried weight were included in the modelling.
[2] Legg et al. (2026b)THE PUBLISHED PERFORMANCE GRAPH
Figure 4 from the British proof-of-concept study.
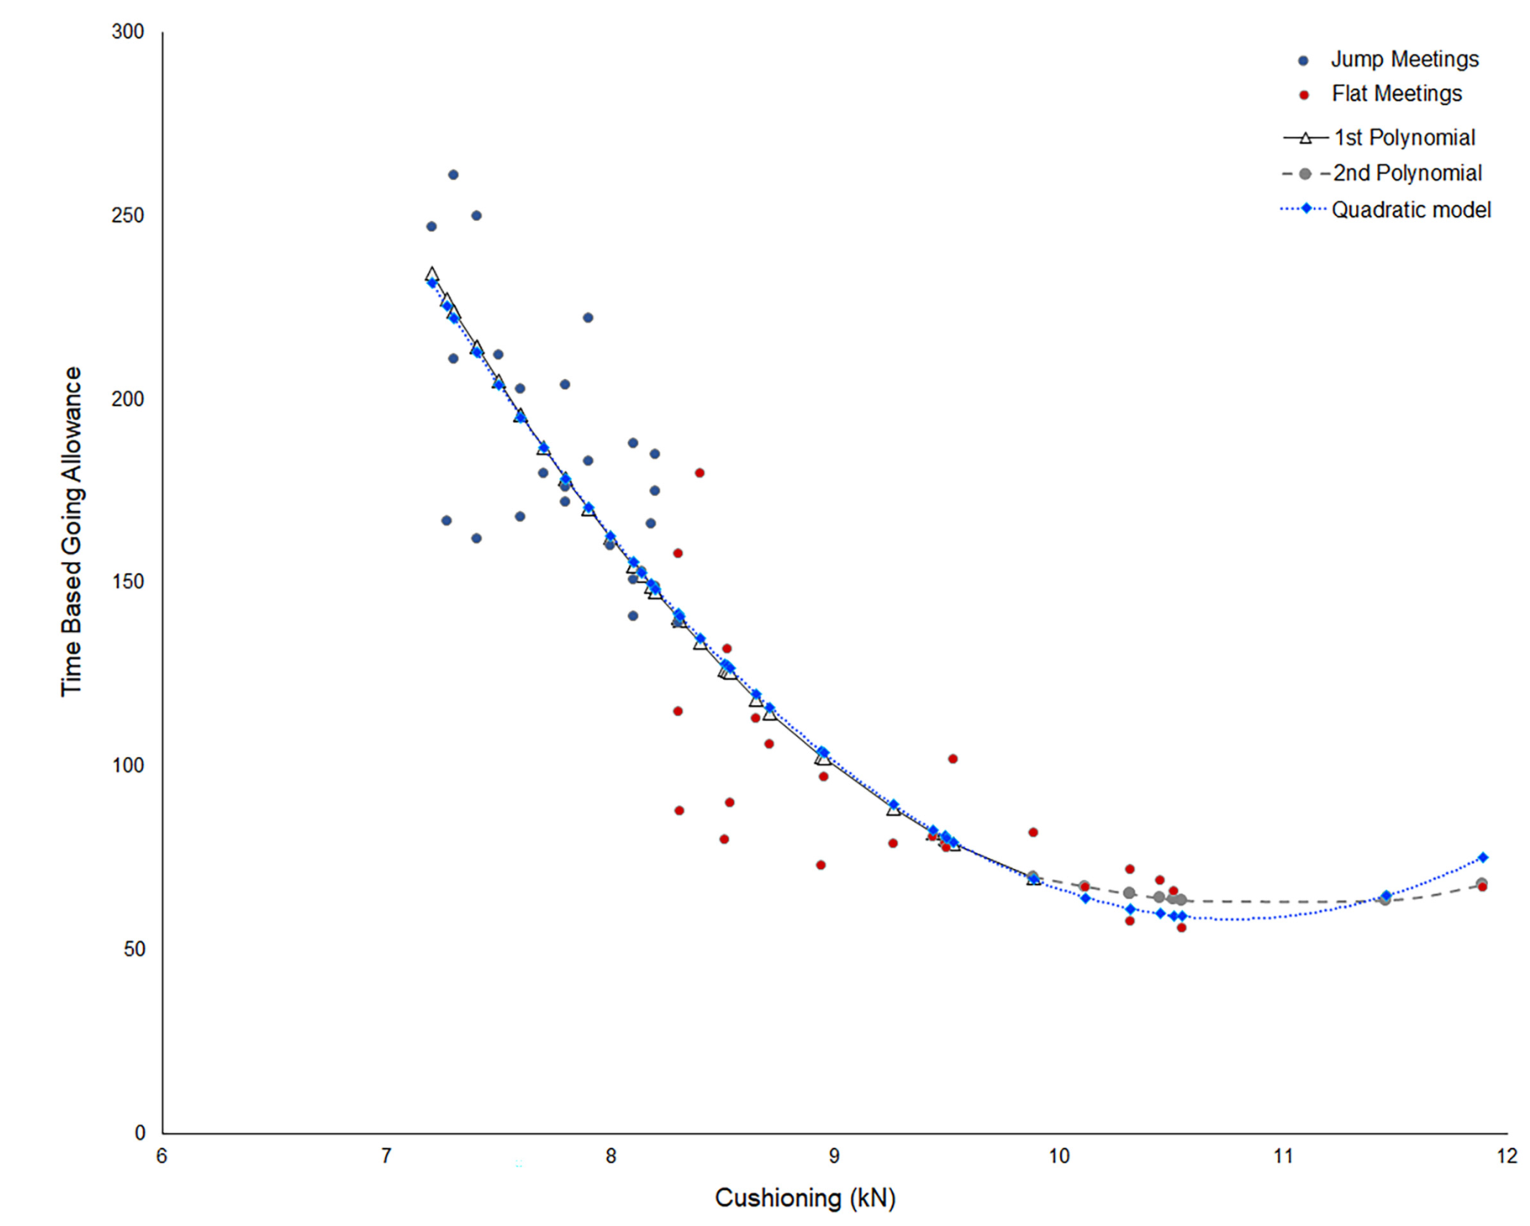
Here, higher cushioning indicates greater support under impact. As cushioning rose, allowance fell: firmer ground was associated with faster going.
The fitted relationship flattened near 9.78 kN (about 10 kN). What happens beyond that point, and how performance and welfare should be considered together, remain questions for ongoing research.
WHY A FORCE OF THIS SCALE MATTERS
The biological context behind the question.
In the discussion of our 2024 study, Hobbs and colleagues place the plateau near 10 kN in the context of the forces a horse’s limbs support at gallop—approximately 10 kN, or around twice the body weight of a 500 kg horse. This gives the performance finding a biomechanical rationale to investigate. [1] Hobbs et al. (2024)
At 17 m/s, Witte and colleagues estimated a peak forelimb force of 24.7 N/kg—about 2.5 body weights—from stride duty factor. The calculation was normalised to total horse, rider and tack mass.
[7] Witte et al. (2006)Self Davies and colleagues measured ground reaction forces beneath individual limbs in seven ridden Thoroughbreds at 9.1–13.7 m/s. Peak vertical forces were about 1–1.7 body weights and varied with speed and limb.
[6] Self Davies et al. (2019)Performance context: limb-force measurements and calculated surface cushioning describe different responses. Their comparable scale supports a research interpretation, rather than a direct conversion between a VST result and a horse’s hoof force. The 2024 result describes meeting-level going; further research across wider conditions can clarify the plateau and the question of how firm is too firm. It does not establish a welfare safety limit.
Ground features in research on adverse horse outcomes, alongside other factors.
An observational British Flat-racing study covering 2000–2013 found firmer official going associated with higher odds of race-day fatality, after considering other recorded factors. Its outcome was all-cause fatality, rather than every type of injury.
[3] Rosanowski et al. (2018)Horse- and race-related factors also mattered, placing ground within the wider welfare picture.
A New Zealand time-series study examined track condition, speed and musculoskeletal injury. It considered how those outcomes changed over time within the studied racing population.
[4] Legg et al. (2026a)Welfare context: these are population-level studies using different ground measures. The New Zealand injury analysis was constrained by small monthly counts. Ground is one factor among many; these results do not establish an individual injury prediction or a universal safe VST value. Further research can clarify how measured surface response relates to welfare outcomes.
WHAT THIS CAN MEAN FOR YOU
Surface measurements describe part of the environment in which the horse moves. Their interpretation depends on the horse, activity and conditions.
A course report adds context alongside official going, local knowledge and what the horse feels like under you.
Consider measured conditions within discussions about suitability and participation, alongside your team’s knowledge of the horse.
Surface information belongs within the welfare conversation. Racing findings need their studied context when considered in other equestrian activities.
These are practical interpretations from Groundlytics. Use them alongside professional judgement, knowledge of the horse and official course information.
PUBLISHED FINDINGS & WORK UNDERWAY
The cited papers address different questions: performance-based going, race speed, hoof loading, musculoskeletal injury or race-day fatality.
The references below give the methods and the population behind each finding.
Read the papers →Groundlytics contributes field measurements, mapping and technical reporting to collaborative racing research. Current work includes Consistent Global Turf Ratings for a Global Sport: The First Step, funded by The Hong Kong Jockey Club Equine Welfare Research Foundation Limited, and the FEI-funded Eventing Cross-Country Going study with the University of Lancashire.
Analysis in these collaborative projects remains underway.
Our commercial monitoring service records surface response and change before racing; research examines further questions using those measurements.
PRIMARY SCIENTIFIC PUBLICATIONS
Evidence reviewed 14 October 2026. Practical interpretations are labelled separately from study findings.
LOOK AT THE MEASUREMENTS
Explore surface response across positions, days and measured racing lines.